
Many readers know I live in Iowa and that Iowa stands in the middle of a big COVID-19 outbreak. I gave a brief local update awhile ago. But it’s time to check in again. Local liberals keep putting the heat on Governor Kim Reynolds. In particular, she’s in the middle of several data scandals. Is it warranted?
Let’s take a look at the data.
COVID-19 Data in Iowa
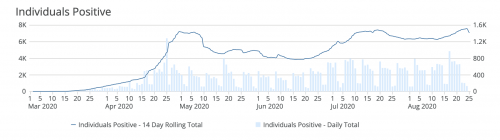
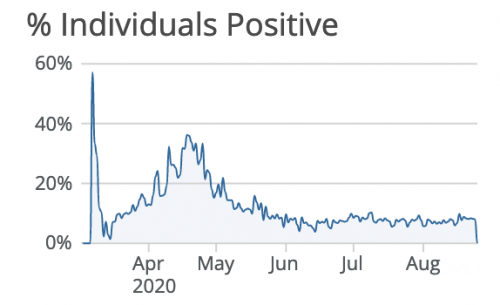
First, let’s look at the statewide data. The first graphic shows the number of tests each day and the 14-day new case average. And the second graphic shows the percentage of positive tests each day.
I’d also show a graphic with deaths, but it closely mirrors the case graphics. The main difference is that there were far more deaths earlier in the pandemic than later, though that may change depending on who recovers and who does not.
So, What’s the Verdict?
At a broad level, the Iowa data mirror the national data. We lag the nation by a couple of weeks. Iowa cases rose rapidly through April, declined in May and early June, and then rose again beginning in late June. There’s early evidence Iowa is spiking again in mid-August, likely due to massive reopenings, especially of schools and colleges.
It’s important to note that the data vary with testing levels and percentage of positives. Technically speaking, mid/late August might be our most drastic spike. But once we look at testing levels in April (low) and percentage positive in April (extremely high), April was probably Iowa’s worst outbreak. So far. August and early September may yet eclipse April.
One thing worth pointing out? Compared to the nation as a whole, Iowa has about the same proportion of cases and significantly fewer deaths. This doesn’t mean Kim Reynolds is doing a good job. She isn’t, especially as it concerns the re-opening of businesses. But Iowa does not have unusually high death rates. In fact, it has relatively low death rates. Why? Probably because we’re a relatively rural state with greater default social distancing than most states.
Finally, I’ll quickly note that I believe the data glitches I referenced at the start of this post have been fixed. But I’m not entirely sure. Some of the distribution across months may change if the state further updates the data.
COVID-19 in Iowa City
So how are things in Iowa City? Bad. Quite bad, in fact. But first, I’ll point out that we don’t have great data on Iowa City. What do we have? Data on Johnson County, Iowa City’s county. We’re Johnson County’s largest city, and we serve well enough as a proxy for the county.
For the good, Mayor Bruce Teague issued a mask mandate about a month ago. It came a bit late, but he faced quite a bit of resistance from the state and from his own city staff. He did well here.
How do the data look? In the several weeks before the mask mandate, Johnson County averaged about 24 cases per day. In the several weeks after Teague issued the ordinance, the county dropped to about 20 cases per day. And since then – since the second week of August, Johnson County has spiked to about 60 cases per day.
OK, so what happened? Teague’s mandate helped stop the rise in cases. But the impending reopening of the University of Iowa caused large-scale social gatherings, particularly in bars, restaurants, and at house parties. The mask mandate was fairly powerless against the overwhelming irresponsibility of the University of Iowa in not going online-only.
Iowa City is in big trouble until the university halts in-person courses.